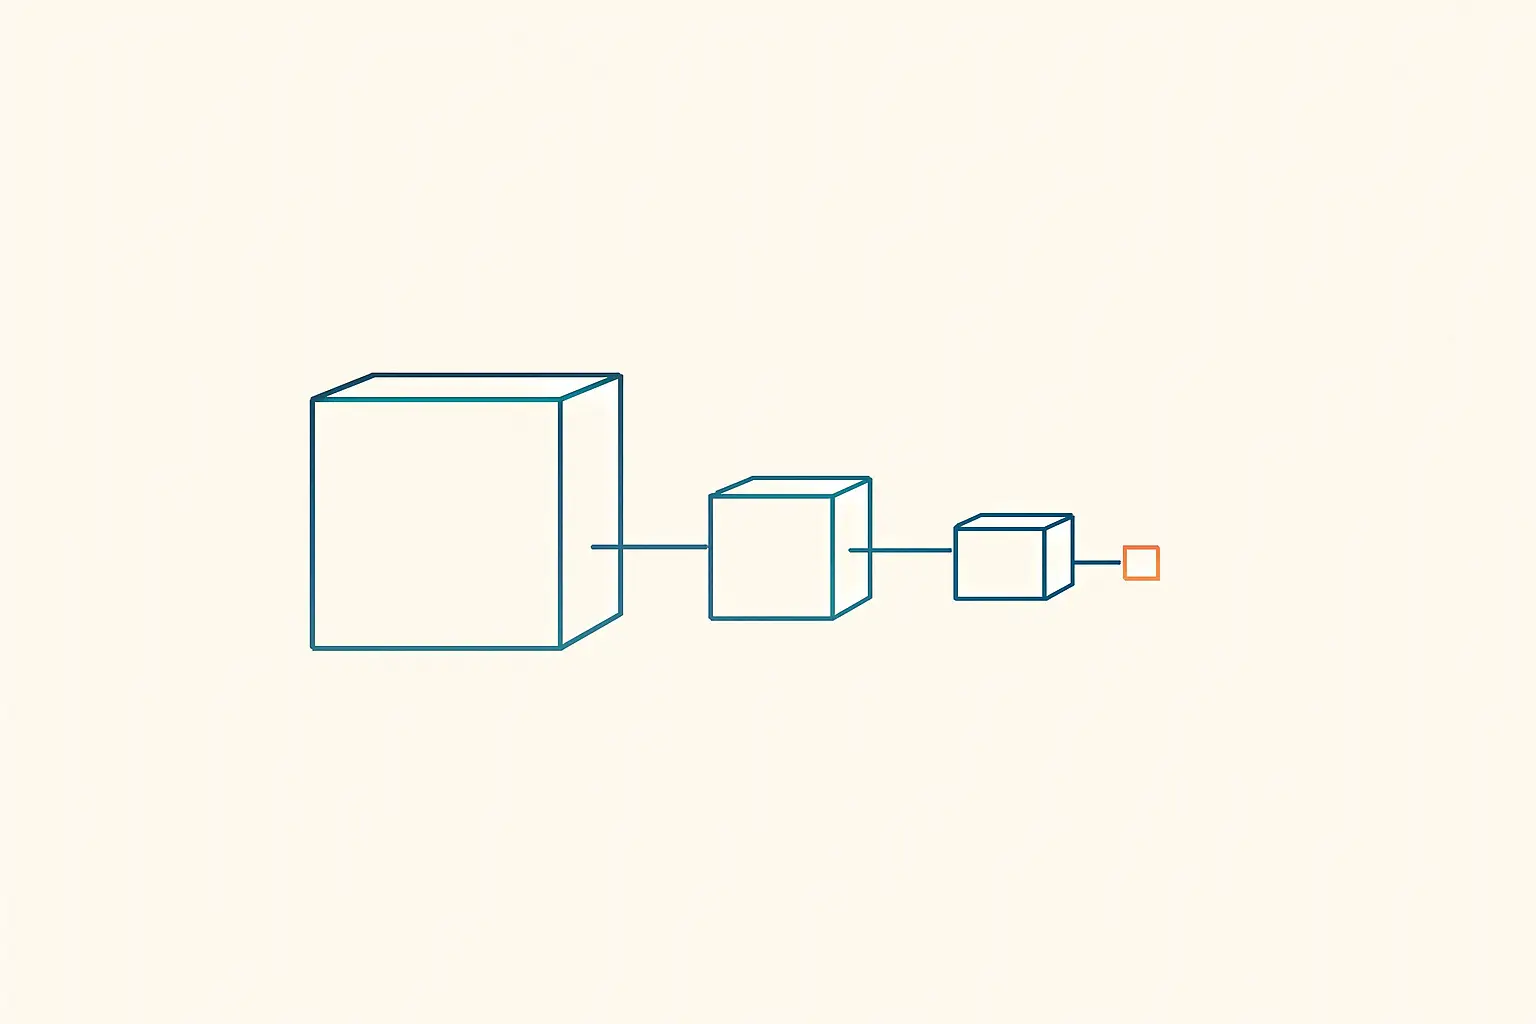
The most common case in the Suite: a service business (installations and renovations, average ticket €3,000-6,000) that arrives with a "General" campaign and €1,500 a month, and that a year later is spending €8,000 a month at a lower cost per customer. This is its architecture, step by step.
Starting point (month 0)
- 1 "General" campaign, 1 ad group, 80 keywords, broad match, €1,500 a month, enhanced CPC.
- Conversions: form and phone click, both primary.
- Google's CPA: €28. Actual customers: nobody knew.
- No separate brand campaign, no negatives, no remarketing.
Step 1 · Measure (months 1-2, €1,500)
Before touching the structure (principle 6):
- Conversions: form and calls longer than 60 s as primary; phone click as secondary.
- GCLID passed to the CRM (a spreadsheet) and status labels; Lead Rating came later, but the habit of tagging starts here.
- The finding: out of 54 "conversions" a month, 19 were real contacts; real CPA €79; close rate 22% → a customer costs €360.
Step 2 · Separate by economics (months 2-4, €2,500)
SEARCH · Brand · ES                     (90% share)          €250
SEARCH · Installations · Region A       (target CPA €70)   €1,000
SEARCH · Renovations · Region A         (target CPA €110)    €800
SEARCH · Maintenance · Region A         (maximise conv.)     €300
Testing reserve                                              €150
Why like this: installations and renovations have different tickets and different close rates (acceptable CPA of €70 and €110); maintenance has a low ticket (no data yet, so no target); brand kept separate. Ad groups by intent: urgency, quote, type of system. Universal negatives + the roots that came out of search term mining. Result by month 4: real cost per contact €64, the same number of customers on €2,500 as before with… no, more: 31 contacts a month.
Step 3 · A second region and portfolios (months 5-7, €4,500)
The Region B campaigns are born as copies of the Region A ones (same structure, their own budget), but with no data. The fix: portfolios by service grouping A and B:
INSTALLATIONS portfolio (A + B) · target CPA €70
RENOVATIONS portfolio (A + B)   · target CPA €110
B learns from A's history from day one; each region keeps its own budget (a reserve per region). Added on top: remarketing on Display (30-day visitors who have not made contact, with contacted users excluded), €300.
Step 4 · Lead quality (months 8-10, €6,000)
Lead Rating: raw with a rating, qualified and sale with an amount, uploaded via GCLID. The portfolios switch to target ROAS on the value of the leads (cross-mode resolved when the strategy changed). The finding: the "quote" ad group in renovations was bringing in low-rated leads (price comparers); the "urgency" group in installations brought the best. The budget shifted on its own. Cost per customer: €290 (down from €360).
Step 5 · Scale (months 11-12, €8,000)
- Region C as a copy inside the portfolios.
- Visual remarketing Demand Gen (a 15-second video shot on a phone): €400.
- PMax no: with no catalogue, with lead generation and with Search well covered, it would not add anything; it was tested for a month with brand excluded and it contributed 4% incremental conversions at a CPA 60% higher. Out.
- Guardian, SQONS, QS Analyzer and SBNS running from step 2; the Agent from step 3.
Before and after
| Month 0 | Month 12 | |
|---|---|---|
| Spend | €1,500 | €8,000 |
| Google "conversions" | 54 | 210 (qualified) |
| Real contacts | 19 | 118 |
| Customers | ~4 | ~27 |
| Cost per customer | ~€360 | ~€295 |
| Campaigns / portfolios | 1 / 0 | 9 / 2 |
| Management hours per month | ~12 | ~6 (with scripts) |
The mistakes that were avoided
- Separating before measuring (it would have split the account according to the inflated conversions).
- Copying regions without a portfolio (B would have taken months to learn).
- Adding PMax "because Google recommended it".
- Judging by Google's CPA (€28 → "it is doing fine").
💡 Ninja trick: the order in this case is the Suite's order: measurement → negatives and QS → Smart Bidding with a judge → Lead Rating → scaling with Guardian and the Agent keeping watch. Each budget step went in when the previous one had data, not when the client felt like it. It is the pattern that works in small service businesses, and the one we try to reproduce with every new client.
What you should remember
- Measure first; separate by economics (service, region, brand); portfolios to copy regions without losing the learning; lead quality to judge by customers; scale by adding.
- PMax is not compulsory: you test it with brand excluded and judge it on incrementality.
- The cost per customer falls while spend multiplies by five, because every step was built on data.